I had some problems with the internet, so I am posting this entry a little later that expected. But anyway, this is it - the final part of the tutorial about the weather app. You can read the first four parts here:
1,
2,
3,
4. Today I will show you how to display a chart with statistical data from the collected weather details.
I googled a little to find out what charting system to use for this small project. And I found
Open Flash Chart as an interesting solution. It's a flash-based charting system which uses Ajax requests to get the data for the graphs. That means that we'll need a view which will show the graphs and another view, which will provide the data. Each location will have its own page displaying a chart, so it would be nice to have URLs where each location would be accessed by a slug. We already have a field
sysname which could be used here, but my best practice is to have separate fields for url slugs which might be changed at anytime and sysnames which should be defined once and not changed at all because the sysname binds an object with a template.
So I add this new field to the
Location model in
models.py:
class Location(models.Model):
    #...
    slug = models.SlugField(
        _("slug for urls"),
        max_length=200,
        unique=True,
        blank=True,
        default="",
        )
    #...
Then I create and apply a migration for it:
python manage.py startmigration add_slug --auto
python manage.py migrate climate_change
Let's run the webserver once again. Go to
http://127.0.0.1:8000/admin/climate_change/location/1/, add "berlin" as a slug and save the record.
Next I need to define a view which will display the graphs. This looks as simple as this:
# -*- coding: UTF-8 -*-
from django.shortcuts import get_object_or_404, render_to_response

Location = models.get_model("climate_change", "Location")

def display_charts(request, slug):
    location = get_object_or_404(Location, slug=slug)
    return render_to_response(
        "climate_change/charts.html",
        {'location': location},
        context_instance=RequestContext(request),
        )
Whereas the template created at
templates/climate_change/charts.html includes this code:
{% extends "base.html" %}

{% load i18n %}

{% block title %}{{ location.name }}{% endblock %}

{% block header %}
    </code><h1>{{ location.name }}</h1>
{% endblock %}

{% block content %}
    <div class="chart-temperature">
        <h2>{% trans "Temperature" %}</h2>
        <object type="application/x-shockwave-flash" data="/media/flash/open-flash-chart.swf?data-file={% url climate_change_temperature slug=location.slug %}" height="250" width="500">
            <param name="movie" value="/media/flash/open-flash-chart.swf?data-file={% url climate_change_temperature slug=location.slug %}">
            <param name="allowScriptAccess" value="sameDomain">
            <param name="quality" value="high">
        </object>
    </div>
    <div class="chart-humidity">
        <h2>{% trans "Humidity" %}</h2>
        <object type="application/x-shockwave-flash" data="/media/flash/open-flash-chart.swf?data-file={% url climate_change_humidity slug=location.slug %}" height="250" width="500">
            <param name="movie" value="/media/flash/open-flash-chart.swf?data-file={% url climate_change_humidity slug=location.slug %}">
            <param name="allowScriptAccess" value="sameDomain">
            <param name="quality" value="high">
        </object>
    </div>
    <div class="chart-wind-speed">
        <h2>{% trans "Wind speed" %}</h2>
        <object type="application/x-shockwave-flash" data="/media/flash/open-flash-chart.swf?data-file={% url climate_change_wind_speed slug=location.slug %}" height="250" width="500">
            <param name="movie" value="/media/flash/open-flash-chart.swf?data-file={% url climate_change_wind_speed slug=location.slug %}">
            <param name="allowScriptAccess" value="sameDomain">
            <param name="quality" value="high">
        </object>
    </div>
    <div class="chart-visibility">
        <h2>{% trans "Visibility" %}</h2>
        <object type="application/x-shockwave-flash" data="/media/flash/open-flash-chart.swf?data-file={% url climate_change_visibility slug=location.slug %}" height="250" width="500">
            <param name="movie" value="/media/flash/open-flash-chart.swf?data-file={% url climate_change_visibility slug=location.slug %}">
            <param name="allowScriptAccess" value="sameDomain">
            <param name="quality" value="high">
        </object>
    </div>
{% endblock %}
Also let's not forget to download the Open Flash Chart flash file itself which is in the archive of
this package. I placed the file
open-flash-chart.swf at
media/flash.
Originally, Open Flash Chart uses PHP on the server side to provide data to the flash-based client side. But fortunately there is a port to python which I will be using for forming the data to the charts. I don't want to get dirty fingers by creating all this manually forming JSON object using
simplejson, especially because there is not complete reference of Open-Flash-Chart API (just examples and tutorials). So I downloaded
python port, extracted the content and copied
OpenFlashChart.py to
climate_change_env/lib/python2.5/site-packages/ which is the location of python libraries which will be installed a.k.a. under python path for the virtual environment "climate_change_env".
Using the examples found at a
tutorial, I created a view for providing chart data. The
views.py looks now like this:
# -*- coding: UTF-8 -*-
from datetime import datetime, timedelta
from random import random

# http://open-flash-chart-python.googlecode.com/files/Python%202.10.zip
from OpenFlashChart import Chart

from django.db import models
from django.http import HttpResponse
from django.template import RequestContext
from django.shortcuts import get_object_or_404, render_to_response
from django.utils.translation import ugettext as _
from django.utils.encoding import force_unicode

Location = models.get_model("climate_change", "Location")
WeatherLog = models.get_model("climate_change", "WeatherLog")

def display_charts(request, slug):
    location = get_object_or_404(Location, slug=slug)
    return render_to_response(
        "climate_change/charts.html",
        {'location': location},
        context_instance=RequestContext(request),
        )

def rgb_to_html_color(r, g, b):
    """ convert an R, G, B to #RRGGBB """
    return '#%02x%02x%02x' % (r, g, b)

def json_get_statistics(request, slug, field):
    location = get_object_or_404(Location, slug=slug)
    extreme_values = location.weatherlog_set.aggregate(
        models.Min(field),
        models.Max(field),
        models.Min("timestamp"),
        models.Max("timestamp"),
        )
    elements = []

    for year in range(
        extreme_values['timestamp__min'].year,
        extreme_values['timestamp__max'].year + 1,
        ):
        element = Chart()
        monthly_values = []
        for month in range (1, 13):
            monthly = location.weatherlog_set.filter(
                timestamp__year=year,
                timestamp__month=month,
                ).aggregate(models.Avg(field))
            monthly_values.append(monthly['%s__avg' % field])
        element.values = monthly_values
        element.type = "line"
        element.dot_style.type = "dot"
        element.dot_style.dot_size = 5
        random_html_color = rgb_to_html_color(
            r=63+int(random() * 128),
            g=63+int(random() * 128),
            b=63+int(random() * 128),
            )
        element.dot_style.colour = random_html_color
        element.width = 4
        element.colour = random_html_color
        element.text = str(year)
        element.font_size = 10
        elements.append(element)

    # Create chart
    chart = Chart()
    chart.y_axis.min = float(str(extreme_values['%s__min' % field]))
    chart.y_axis.max = float(str(extreme_values['%s__max' % field]))
    chart.y_axis.font_size = 10
    chart.title.text = force_unicode(WeatherLog._meta.get_field(field).verbose_name)
    chart.x_axis.labels.labels = [
        _("Jan"), _("Feb"), _("Mar"), _("Apr"),
        _("May"), _("Jun"), _("Jul"), _("Aug"),
        _("Sep"), _("Oct"), _("Nov"), _("Dec"),
        ]

    #
    # here we add our data sets to the chart:
    #
    chart.elements = elements

    return HttpResponse(chart.create())
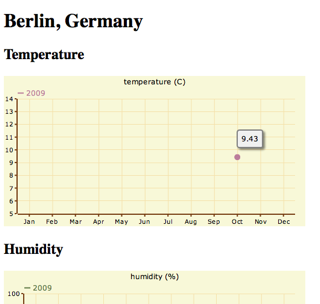
If I run the webserver again and go to
http://127.0.0.1:8000/climate-change/berlin/, I see a single dot in each graph.
We need some more data. There is Time Machine app in the Applications directory in my computer, so let's use it to move forward to year 2012 to check weather statistics. Damn it! It didn't function properly. Then I'll need to generate statistical data myself. Anyway, according to Mark Twain, there are three kinds of lies: lies, damned lies, and statistics.
I'll use python interactive development environment a.k.a. shell to prepopulate that data.
python manage.py shell
>>> from django.db import models
>>> Location = models.get_model("climate_change", "Location")
>>> location = Location.objects.get(sysname="berlin")
>>> extremes = (
...     (-5, 4), (-4, 5), (-2, 10), (2, 15),
...     (6, 20), (9, 24), (11, 25), (10, 25),
...     (7, 20), (4, 15), (0, 9), (-2, 5),
...     )
>>> from random import random
>>> from datetime import datetime
>>> for year in range(2009, 2012):
...     for month in range(1, 13):
...         temp_range = extremes[month-1][1] - extremes[month-1][0]
...         t = extremes[month-1][0] + int(random() * temp_range)
...         location.weatherlog_set.create(
...             timestamp=datetime(year, month, 1),
...             temperature=t,
...             humidity=int(random()*100),
...             wind_speed="%.2f" % (random()*372),,
...             visibility="%.2f" % (random()*100),
...             )
I defined minimal and maximal temperatures for each month in a tuple of tuples. Then I went through three years and for each month of that year I added random temperatures which would be in the range of minimal and maximal temperatures for that month. Humidity, wind speed and visibility are randomized without monthly ranges. The graph after data population looks like this:

That's it. Finally, I completed this tutorial. You had a chance to watch the process of Django app development. You saw, how virtualmin, migrations and third-party libraries can be used. Hopefully, you got some inspirations to create something cool by yourself just for fun.
I will publish the full code soon somewhere and you'll have a chance to download it and modify.
If something is too confusing, you don't understand some part of the tutorial, or you think that it could be improved somehow, don't hesitate to write comments.

